
Goldie's Math Emporium
Goldie’s AP® Statistics UNIT 1 PLANS – Exploring One Variable Data (2020 CED)
Goldie’s AP® Statistics UNIT 1 PLANS – Exploring One Variable Data (2020 CED)
Couldn't load pickup availability
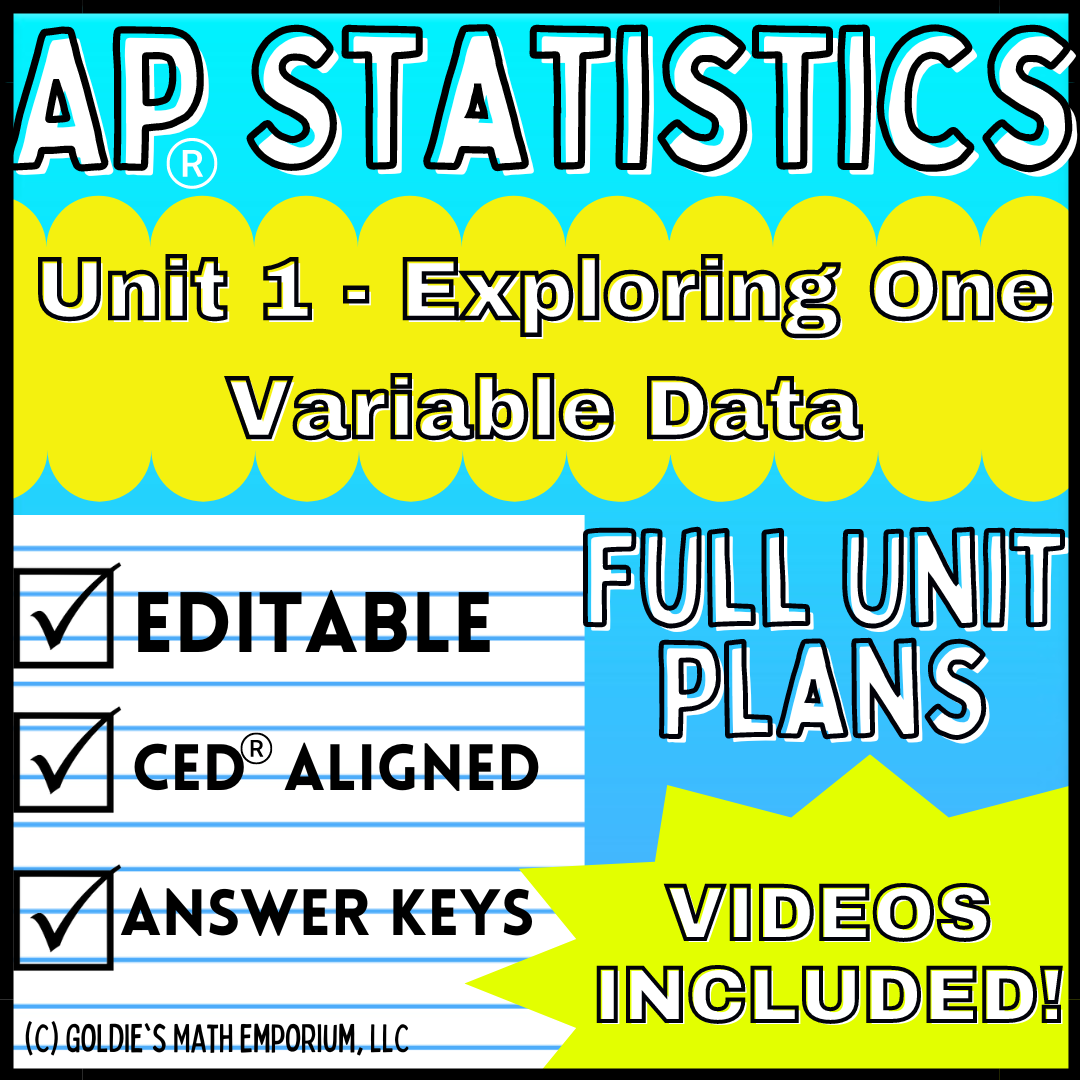
AP® Statistics Unit 1 – Exploring One Variable Data
This resource has been archived as a legacy resource. The updated version can be found here, though this version will remain available for use.
Complete Unit Bundle
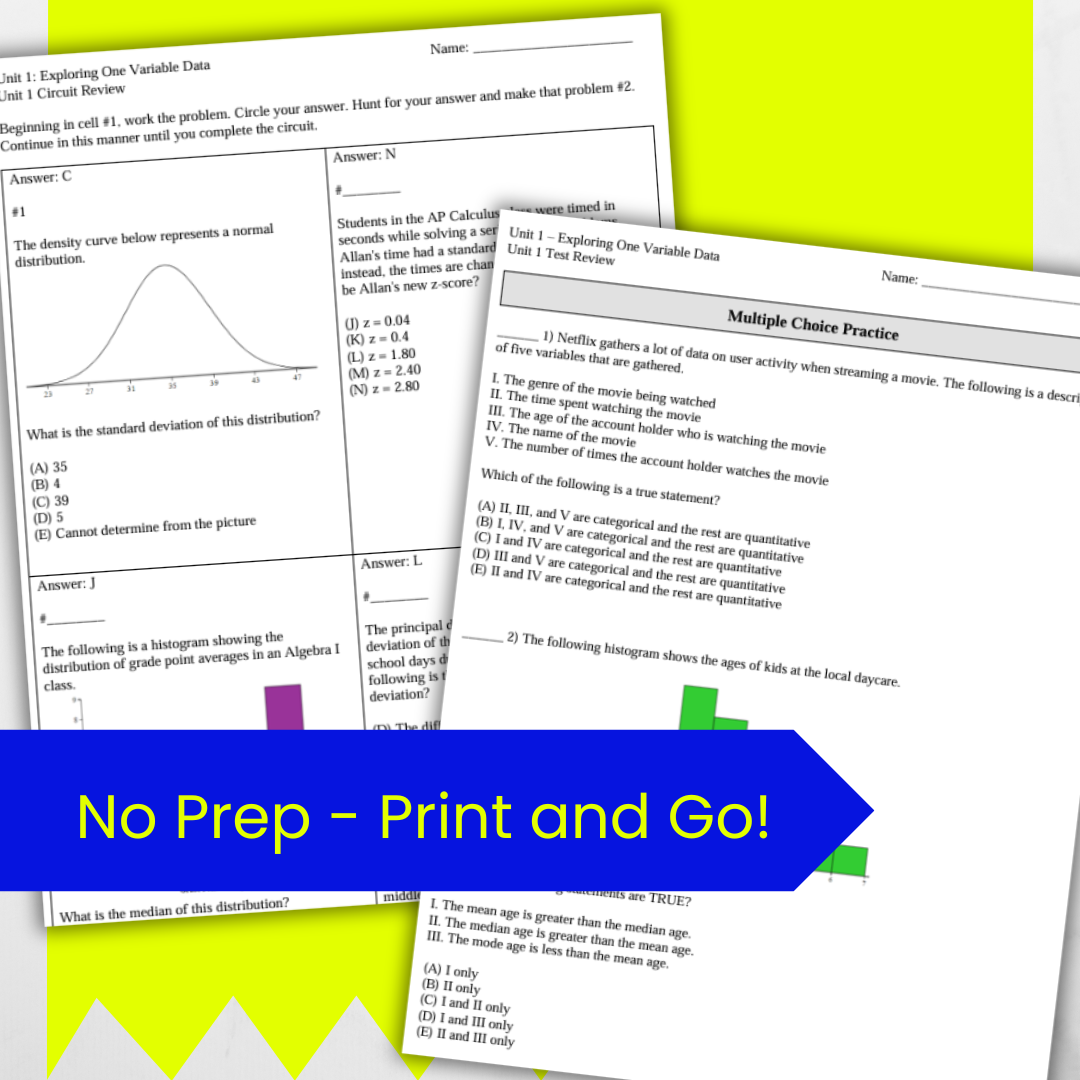
This all-in-one unit includes everything you need to teach Unit 1 of AP® Statistics: Exploring One-Variable Data. This bundle covers graphical and numerical summaries of both categorical and quantitative data. Students will learn how to represent data with appropriate graphs and tables, describe distributions using center and spread, and analyze data using normal distribution concepts like z-scores and percentiles.
Whether you're a first-time AP® Statistics teacher or looking to streamline your prep with high-quality, editable resources, this bundle is designed to make planning, instruction, and assessment easier and more effective.
This product is a .zip folder with the following items:
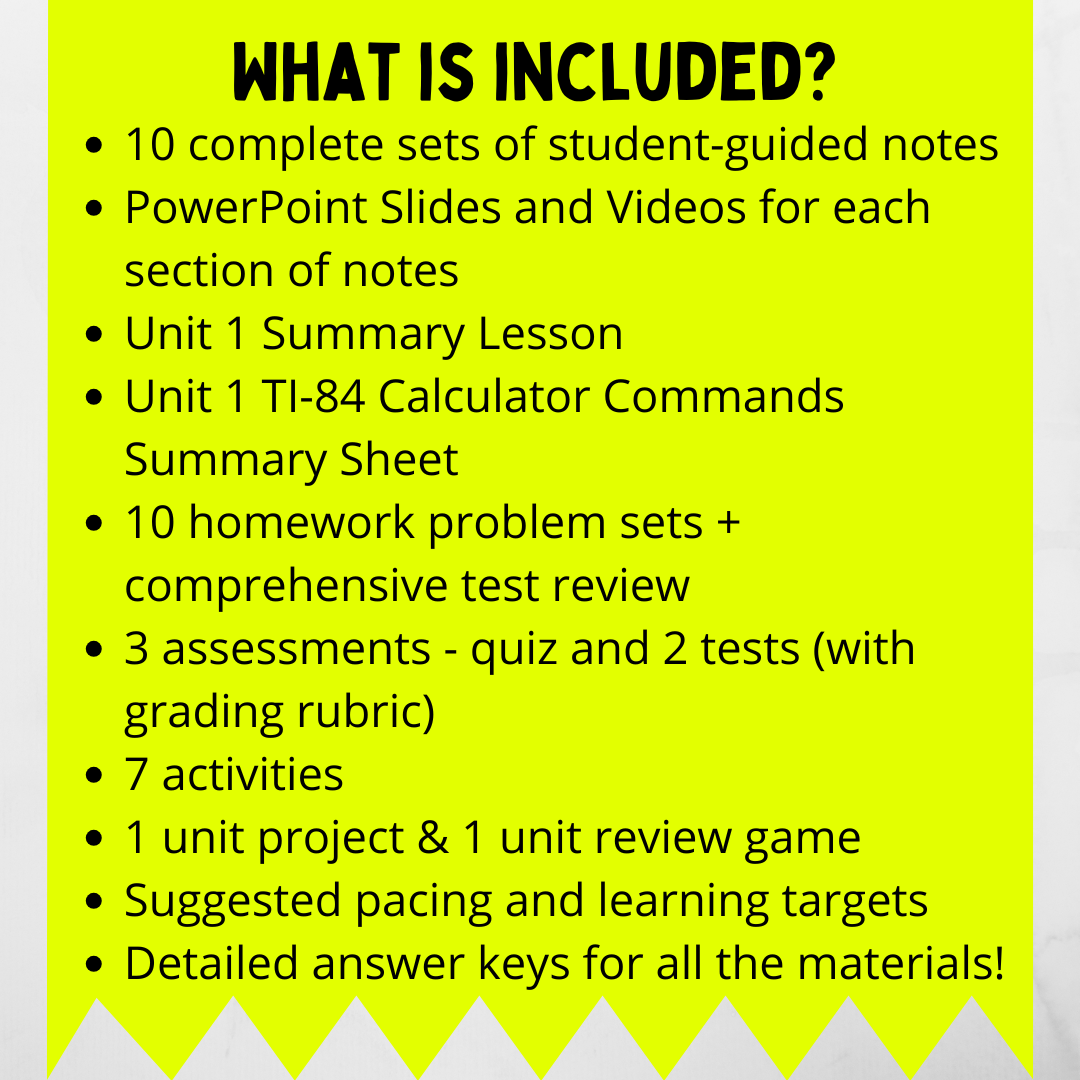
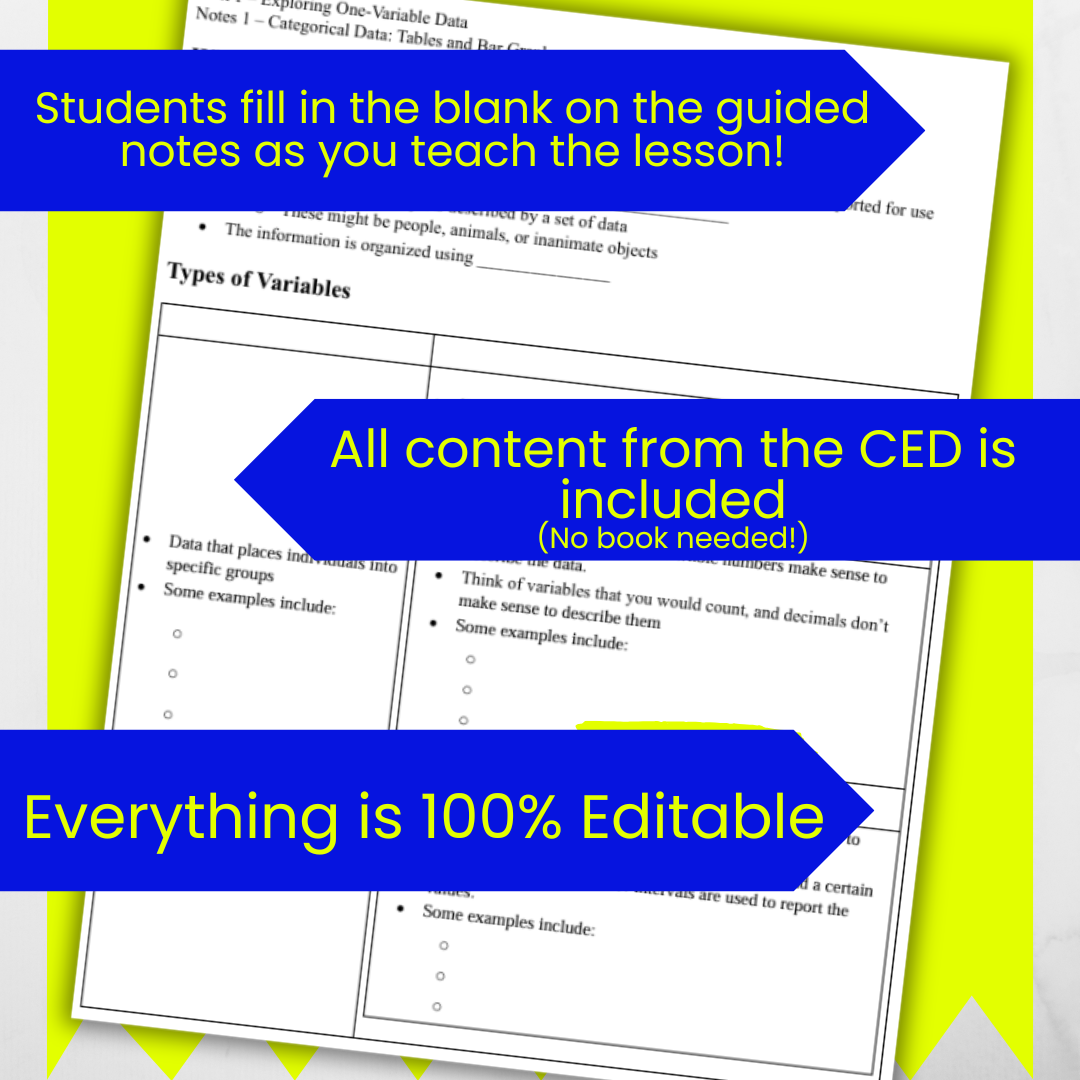
✅ 10 complete sets of student-guided notes
✅ Editable PowerPoint slides and video links for each lesson
✅ 10 sets of homework problems and a thorough unit review
✅ 3 assessments: one quiz and two unit tests (with grading rubrics)
✅ 8 engaging activities and projects aligned to Unit 1 skills
✅ A TI-84 Calculator Commands Reference Sheet
✅ A visual class summary lesson for Unit 1
✅ A student-friendly Jeopardy-style review game
✅ Suggested pacing guide for Unit 1
Key Features:
• 100% editable in Word format -- make it fit your classroom style
• PDF versions and answer keys included for all materials
• No textbook required -- built to be a standalone curriculum
• Aligned to the AP® Statistics Course and Exam Description (CED)
• Classroom-tested and designed by an experienced AP® Statistics teacher
This Unit 1 bundle is also included in my full-year resource: Goldie’s AP® Statistics Full Curriculum, which provides a complete, textbook-free path through the entire AP® Stats course.
Topics Covered:
🎯Displaying and interpreting categorical and quantitative data
🎯Creating and analyzing dotplots, histograms, boxplots, and bar graphs
🎯Measures of center (mean, median) and spread (range, IQR, standard deviation)
🎯Comparing distributions and describing shape, center, and variability
🎯Understanding and applying the normal distribution, z-scores, and percentiles
All materials are designed to support deep understanding and real AP-level thinking, while being flexible and approachable for students.
******************************************************************************
If you need extra explanations or guidance, I would love to help!! Contact me at goldiesmathemporium[at]gmail.com for any questions or samples.
I want to provide the best possible resources to help other teachers out! You will be notified of any future updates and additions to this product and it will be free of charge. Your support is important and I thank you for allowing me to continue doing what I love to do.
AP® is a trademark registered by the College Board®, which is not affiliated with, and does not endorse, this product.
Note: I am not affiliated with nor endorsed by any textbook or other curriculum provider. I am a classroom teacher who creates curriculum materials to help other teachers.
© Goldie’s Math Emporium, LLC
This work is bound by copyright laws and editing (beyond your own classroom use), selling, redistributing, or posting all or part of these documents on the Internet is strictly prohibited. Violations are subject to the Digital Millennium Copyright Act.