

Goldie's Math Emporium
Statistics: Confidence Intervals
Statistics: Confidence Intervals
Couldn't load pickup availability
Statistics
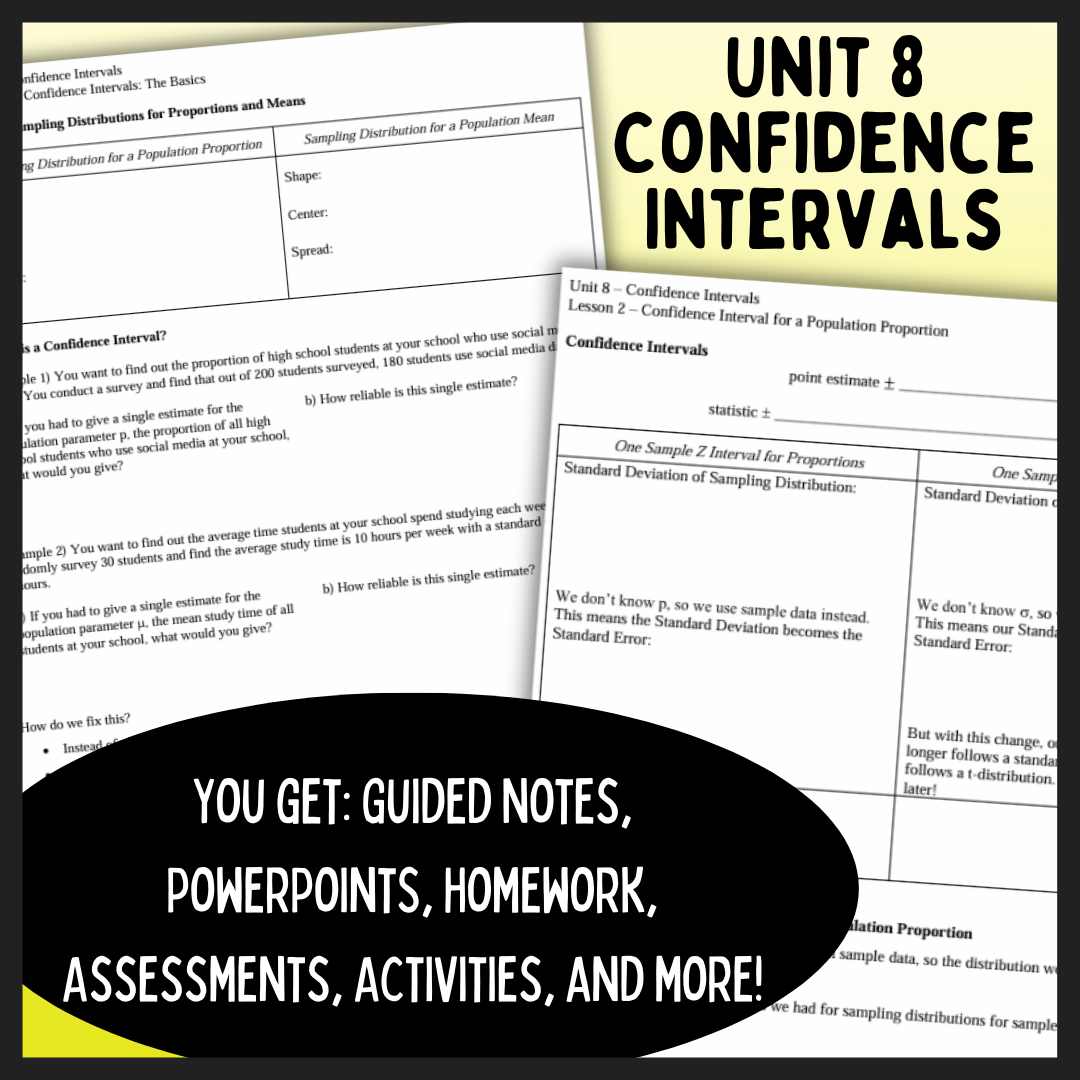
Unit 8: Confidence Intervals
Explore comprehensive resources designed to teach students everything they need to know about confidence intervals for proportions and means. This unit bundle includes editable guided notes, homework sets, assessments, and engaging activities to support thorough understanding.
Included in this resource:
- 7 complete sets of student guided notes (answer keys & PowerPoints included)
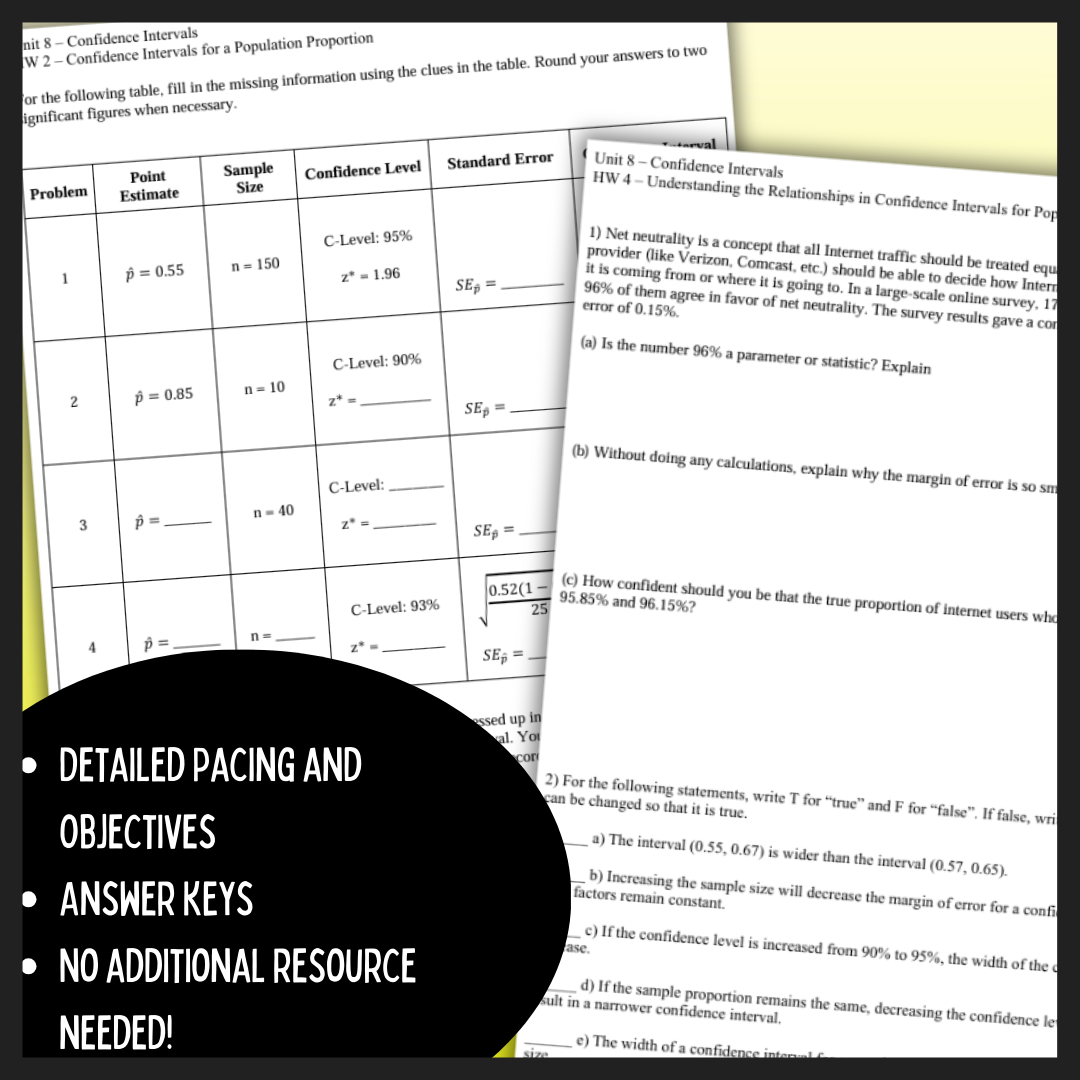
- 7 homework problem sets + complete test review (answer keys included)
- 2 assessments – quiz and test (answer keys included)
- An in-class review summary
- 5 additional activities
- Suggested pacing and learning targets
All of the resources are 100% editable, to modify to fit your classroom needs. The zip folder includes the Word documents and PowerPoint presentations, which you have permission to edit completely with your license purchase. The PDF version and answer keys are included for your convenience.
I teach this course without a textbook, so everything that is provided here, can be used without supplementation.
******************************************************************************
The student-friendly learning targets for this unit are:
- Students will be able to explain what a confidence interval is and how it is used to estimate a population parameter.
- Students will be able to verify the conditions for calculating the confidence interval for a population proportion.
- Students will calculate and interpret a confidence interval for a population proportion.
- Students will determine the margin of error for a given sample size and an estimate for the sample size that will result in a given margin of error for a population proportion.
- Students will identify the relationships between sample size, width of a confidence interval, confidence level, and margin of error for a population proportion.
- Students will be able to describe the t-distribution, explain its key properties, and understand when and why it is used instead of the normal distribution in statistical analysis.
- Students will be able to verify the conditions for calculating the confidence interval for a population mean.
- Students will calculate and interpret a confidence interval for a population mean.
- Students will determine the margin of error for a given sample size and an estimate for the sample size that will result in a given margin of error for a population mean.
- Students will identify the relationships between sample size, width of a confidence interval, confidence level, and margin of error for a population mean.
The Common Core Math Standards covered in this unit are:
- S-ID.1: Represent data with plots on the real number line (dot plots, histograms, and box plots).
- S-ID.2: Use statistics appropriate to the shape of the data distribution to compare center (median, mean) and spread (interquartile range, standard deviation or two more different data sets).
- S-ID.4: Use the mean and standard deviation of a data set to fit it to a normal distribution and to estimate population percentages. Recognize that there are data sets for which such a procedure is not appropriate. Use calculators, spreadsheets, and tables to estimate areas under the normal curve.
- S-IC.1: Understand statistics as a process for making inferences about population parameters based on a random sample from that population.
- S-IC.2: Decide if a specified model is consistent with results from a given data-generating process, e.g., using simulation.
- S-IC.3: Recognize the purposes of and differences among sample surveys, experiments, and observational studies; explain how randomization relates to each.
- S-IC.4: Use data from a sample survey to estimate a population mean or proportion; develop a margin of error through the use of simulation models for random sampling.
- S-IC.6: Evaluate reports based on data.
******************************************************************************
Goldie's Curriculums:
- Statistics: The Complete Curriculum Bundle (Units 1 – 12)
- Statistics: Semester 1 Curriculum Bundle (Units 1 – 6)
- Statistics: Semester 2 Curriculum Bundle (Units 7 – 12)
Goldie's Individual Units:
- Unit 1 – One-Variable Data
- Unit 2 – The Normal Distribution
- Unit 3 – Two-Variable Data
- Unit 4 – Collecting Data
- Unit 5 – Probability
- Unit 6 – Random Variables
- Unit 7 – Sampling Distributions
- Unit 8 – Confidence Intervals
- Unit 9 – Hypothesis Testing
- Unit 10 – Comparing Two Populations
- Unit 11 – Chi-Square Distributions
- Unit 12 - Inference for Regression
Goldie's Individual Resources:
- Statistics Semester 1 Assessment Bundle
- Statistics Semester 2 Assessment Bundle
- M&M Statistics Activity Bundle
- Statistics: Semester 1 Final Exam and Study Guide
- Statistics: Semester 2 Final Exam and Study Guide
******************************************************************************
If you need extra explanations or additional guidance, I would love to help!! Contact me at goldiesmathemporium[at]gmail.com for any questions or samples.
I want to provide the best possible resources to help other teachers out! You will be notified of any future updates and additions to this product and it will be free of charge. Your support is important and I thank you for allowing me to continue doing what I love to do.
Note: I am not affiliated with nor endorsed by any textbook or other curriculum provider. I am a classroom teacher who creates curriculum materials to help other teachers.
© Goldie’s Math Emporium, LLC
This work is bound by copyright laws and editing (beyond your own classroom use), selling, redistributing, or posting all or part of these documents on the Internet is strictly prohibited. Violations are subject to the Digital Millennium Copyright Act.