Goldie's Math Emporium
Statistics: One Variable Data
Statistics: One Variable Data
Couldn't load pickup availability
Statistics
Unit 1: One Variable Data
In this all-in-one unit, students will learn to classify variables, create various data representations, interpret percentiles and measures of center and variability, and analyze data distributions using graphs and plots. This curriculum was designed for a regular, on-level Statistics course in high school.
Included in this resource:
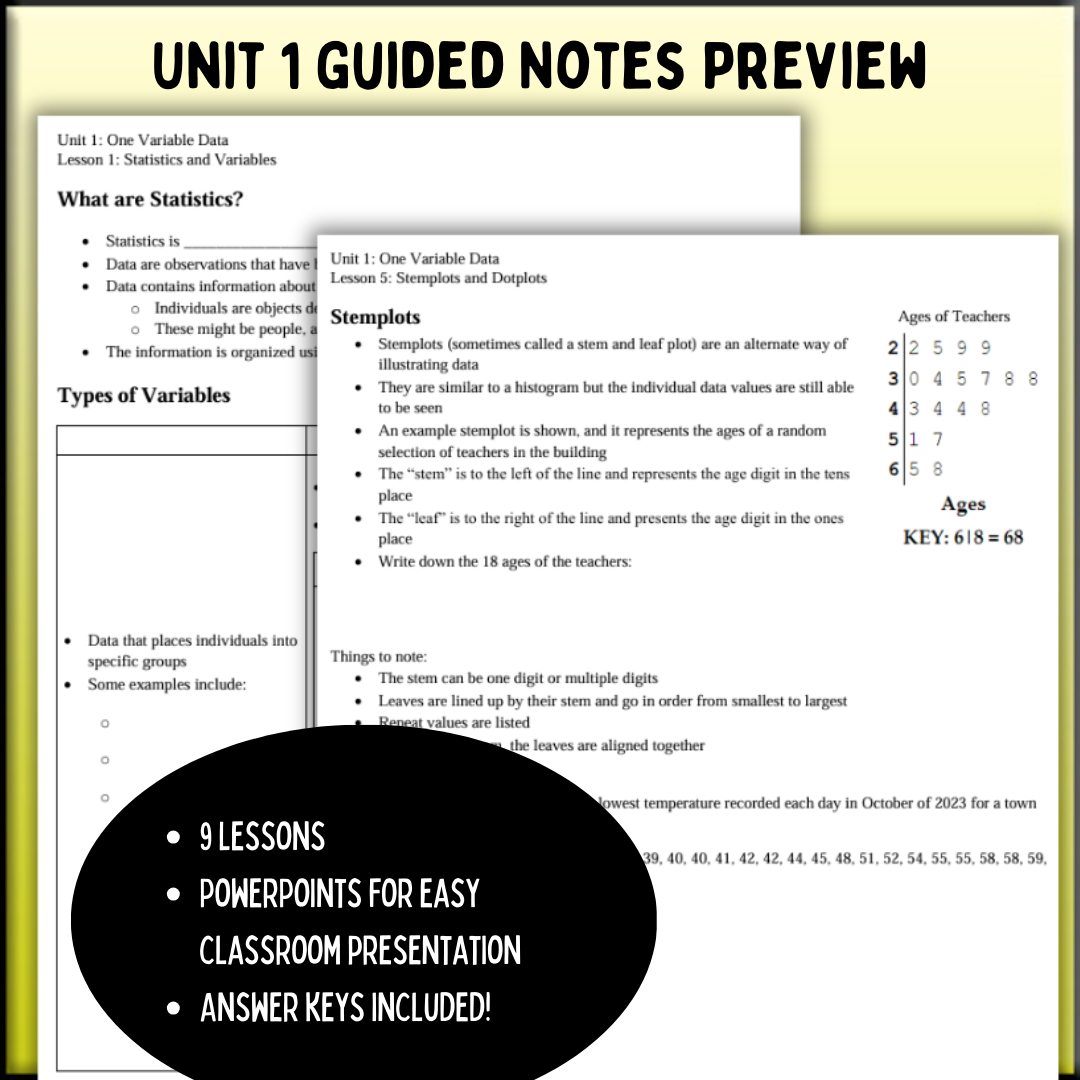
- 9 complete sets of student-guided notes (PowerPoint Presentations and answer keys included)
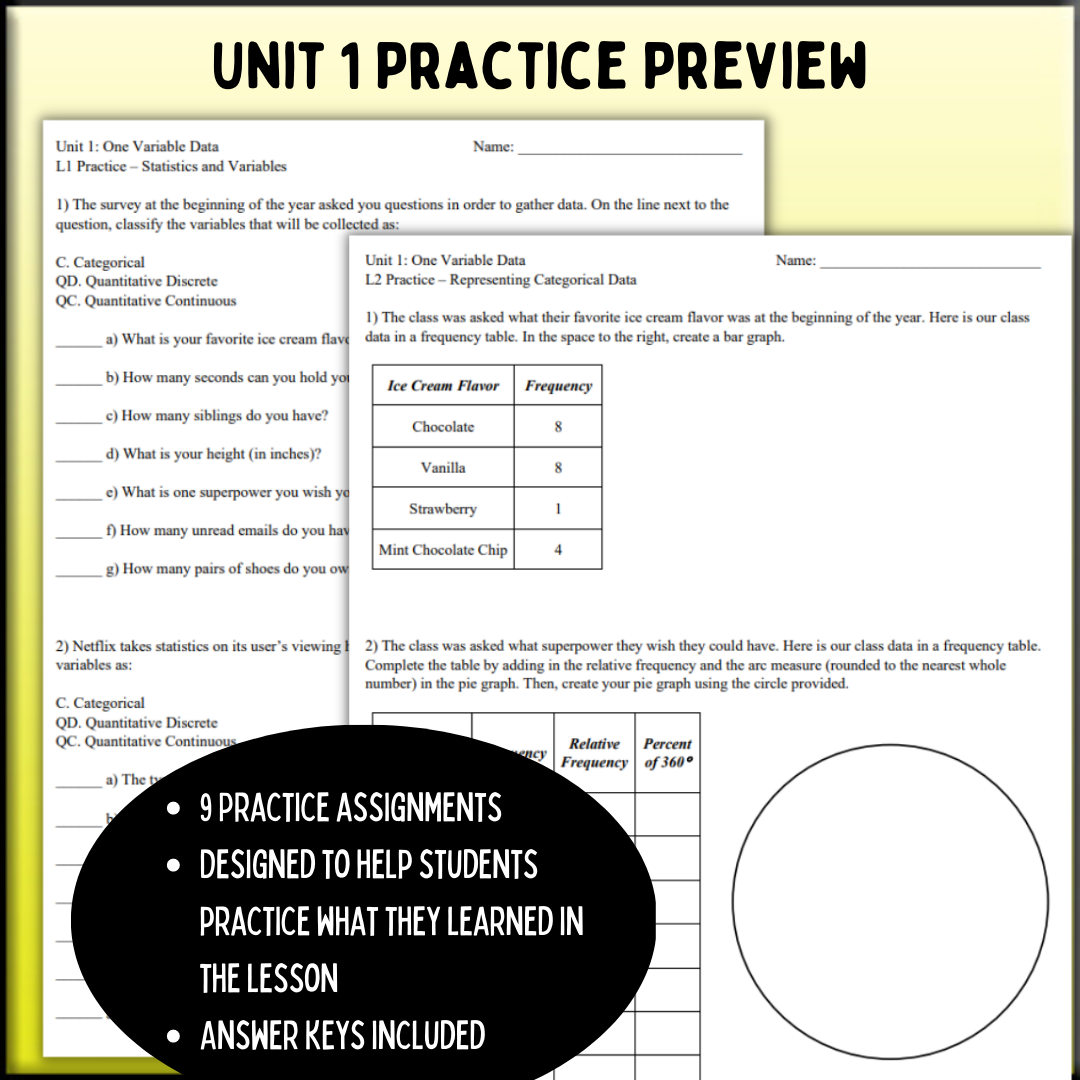
- 9 homework problem sets + complete test review (annotated answer keys included)
- 3 assessments – 2 quizzes and test (answer keys included)
- 3 in-class review PowerPoint presentations
- 3 activities
- 1 project
- 1 Jeopardy Review Game
- Suggested pacing and learning targets
All of the resources are 100% editable, so you will be able to modify to fit your classroom needs. The zip folder includes the Word document, which you have permission to edit completely. The PDF version and answer keys are included for your convenience.
I teach this course without a textbook, so everything that is provided here, can be used without supplementation.
******************************************************************************
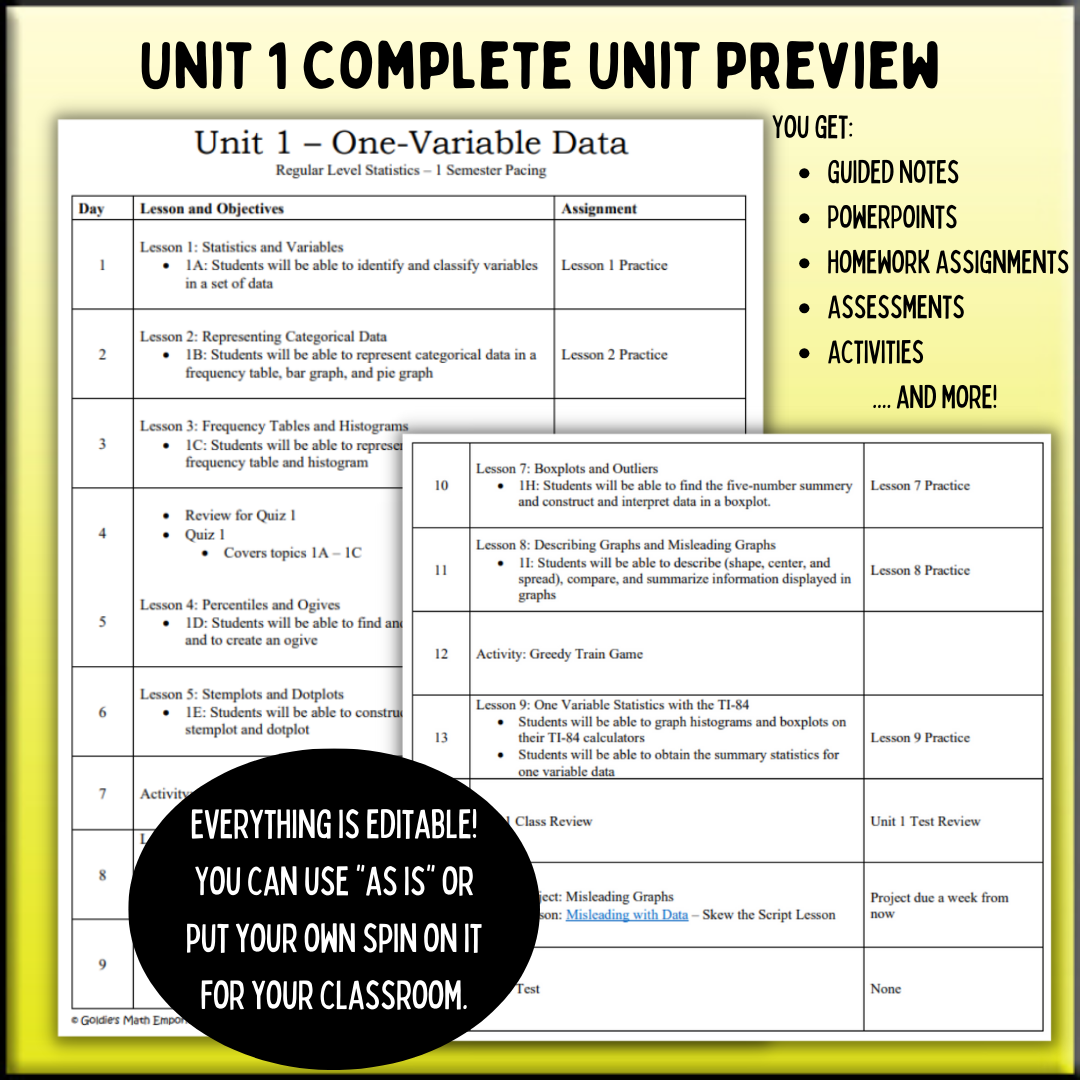
The student-friendly learning targets for this unit are:
- Students will be able to identify and classify variables in a set of data
- Students will be able to represent categorical data in a frequency table, bar graph, and pie graph
- Students will be able to represent quantitative data in a frequency table and histogram
- Students will be able to find and interpret percentiles and create an ogive
- Students will be able to construct and interpret data in a stemplot and dotplot
- Students will be able to calculate the measures of center (mean, median, and mode)
- Students will be able to calculate the measures of variability (standard deviation, IQR, and range)
- Students will be able to find the five-number summary and construct and interpret data in a boxplot.
- Students will be able to describe (shape, center, and spread), compare, and summarize information displayed in graphs
The Common Core Math Standards covered in this unit are:
- ID.A.1: Represent data with plots on the real number line (dot plots, histograms, and box plots).
- ID.A.2: Use statistics appropriate to the shape of the data distribution to compare center (median, mean) and spread (interquartile range, standard deviation) of two or more different data sets.
- ID.A.3: Interpret differences in shape, center, and spread in the context of the data sets, accounting for possible effects of extreme data points (outliers).
******************************************************************************
Goldie's Curriculums:
- Statistics: The Complete Curriculum Bundle (Units 1 – 12)
- Statistics: Semester 1 Curriculum Bundle (Units 1 – 6)
- Statistics: Semester 2 Curriculum Bundle (Units 7 – 12)
Goldie's Individual Units:
- Unit 1 – One-Variable Data
- Unit 2 – The Normal Distribution
- Unit 3 – Two-Variable Data
- Unit 4 – Collecting Data
- Unit 5 – Probability
- Unit 6 – Random Variables
- Unit 7 – Sampling Distributions
- Unit 8 – Confidence Intervals
- Unit 9 – Hypothesis Testing
- Unit 10 – Comparing Two Populations
- Unit 11 – Chi-Square Distributions
- Unit 12 - Inference for Regression
Goldie's Individual Resources:
- Statistics Semester 1 Assessment Bundle
- Statistics Semester 2 Assessment Bundle
- M&M Statistics Activity Bundle
- Statistics: Semester 1 Final Exam and Study Guide
- Statistics: Semester 2 Final Exam and Study Guide
******************************************************************************
If you need extra explanations or additional guidance, I would love to help!! Contact me at goldiesmathemporium[at]gmail.com for any questions or samples.
I want to provide the best possible resources to help other teachers out! You will be notified of any future updates and additions to this product and it will be free of charge. Your support is important and I thank you for allowing me to continue doing what I love to do.
Note: I am not affiliated with nor endorsed by any textbook or other curriculum provider. I am a classroom teacher who creates curriculum materials to help other teachers.
© Goldie’s Math Emporium, LLC
This work is bound by copyright laws and editing (beyond your own classroom use), selling, redistributing, or posting all or part of these documents on the Internet is strictly prohibited. Violations are subject to the Digital Millennium Copyright Act.


